Text analytics and alluvial plots in R
Introduction
In the previous post, we covered how to present textual information in wordcloud. In this post, we are going to extend what we have learned previous with a new visualization technique in town—alluvial plots. An alluvial diagram or alluvial plot is a type of visualization that shows changes in flow over time. Alluvial plots are commonly used to show how information flows from one source and feed to another source or destination. Several packages are used to create alluvial plots, but in this post we are going to learn how to use ggalluvial package (Brunson, 2020) to make alluvial plots in R (R Core Team, 2022). If the package ks installed in your computer, you can simply download and install it from CRAN as;
Before we proceed, we need to load some packages, whose function we are going to use throughout this post. These packages are highlighted in the chunk below;
Data
In this post we are going to assess third year project student titles. The data has been organized and compiled in Excel spreadsheet. We can load this dataset into R session using read_excel() function from readxl package (Wickham and Bryan, 2022) and assign the loaded file as student.
Its a good practice to explore the internal structure of the loaded data, though the str function is widely used for years, but Wickham et al. (2022) developed a glimpse function, which provide a nitty approach to look at the data and its associated variables;
Rows: 163
Columns: 5
$ Name   <chr> "Rashid Rahma A", "Muller Fransisca L", "Bitoye Mancef C", "Mma…
$ gender <chr> "F", "F", "F", "F", "F", "M", "M", "M", "F", "F", "F", "F", "F"…
$ field  <chr> "microbiology", "aquaculture", "ecosystem", "aquaculture", "soc…
$ Title  <chr> "Assessing the prevalence and intensity of parasitic infections…
$ year   <dbl> 2023, 2023, 2023, 2023, 2023, 2023, 2023, 2023, 2023, 2023, 202…
The printed output of the interval structure indicates that the file has five variables—name, gender, field, title and year. With exception of the year, which is numeric, the other variables are characters.
The result indicate that most of the students are doing their research in aquaculture field, social-economics, fishery and ecosystem (Figure 1). Very few students are doing their research in other fields like chemical oceanography, conservation, microbiology and pollution for all four years of this study (Figure 1).
student %>%
  mutate(field = replace(field, field == "GIS" | field == "policy", "fishery"),
         field = replace(field, field == "plankton", "ecosystem"),
         field = replace(field, field == "physical", "pollution")) %>%
  mutate(year = as.factor(year)) %>%
  group_by(gender, field, year) %>%
  count() %>%
  ggplot(aes(axis1 = year, axis3 = gender, axis2 = field, y = n)) +
  geom_alluvium(aes(fill = field), curve_type = "sigmoid", alpha = 0.6, width = 1/3)+
  geom_stratum(aes(fill = field), width = 1/3)+
  geom_label(stat = "stratum", aes(label = after_stat(stratum)), size = 3, alpha = 0.6)+
  theme_void()+
  theme(legend.position = "none")+
  ggsci::scale_fill_futurama()+
  scale_fill_brewer(palette = "Dark2")
  # scale_x_discrete(expand = c(0.1,0.05))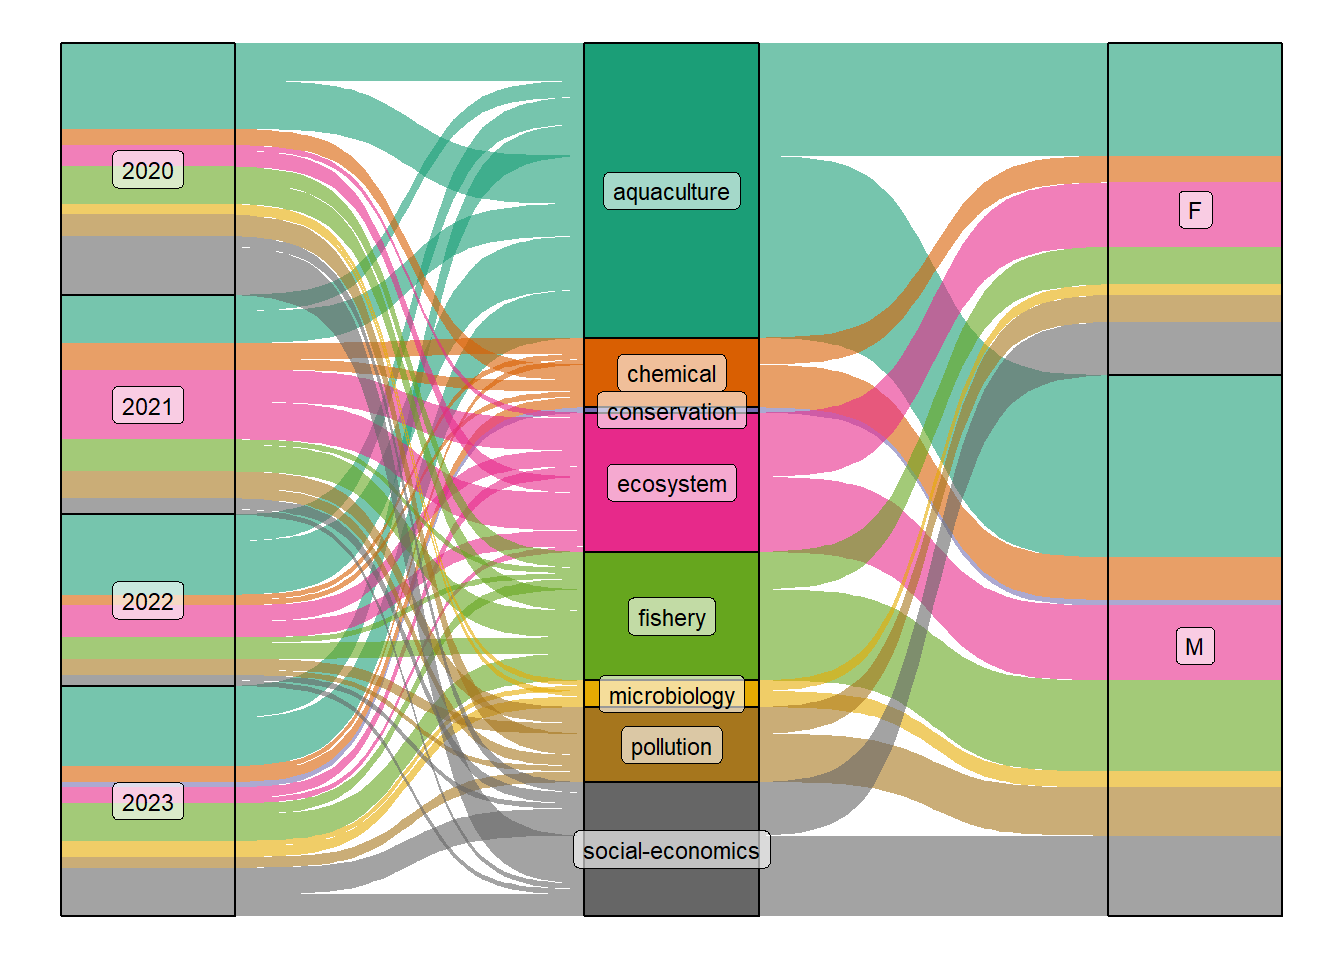
In summary, R language provide a good visualization tool for both quantitative and qualitative data. The alluvial plots is one of the best tool for visualizing the flow of qualitative variables of different categories.